

· By Dr. Wellnosh
Protein Density in Snack Foods: A Practical Guide
Protein density is the amount of protein a food delivers relative to its calories, expressed either as grams of protein per 100 kcal or as the percentage of total calories that come from protein. For practical snacking, aim for options where protein supplies a clearly meaningful amount relative to calories, typically indicating a snack delivering a moderate to substantial protein amount per serving. Understanding protein density in snack foods explains why two snacks with identical protein gram counts on the front of the package can have wildly different nutritional value once you look at the full label.
Table of Contents
- How do you calculate protein density in snack foods?
- How do common snacks actually compare by protein density?
- How much protein should a snack actually provide?
- Why protein density alone doesn’t tell the whole story
- A practical checklist for choosing protein-dense snacks
- Common misconceptions about “high-protein” snack claims
- What the research actually says about protein density
- Key Takeaways
- Why protein density is the metric the snack industry doesn’t want you to use
- Wellnosh protein chips meet the protein-density checklist
- Useful sources for further reading
How do you calculate protein density in snack foods?
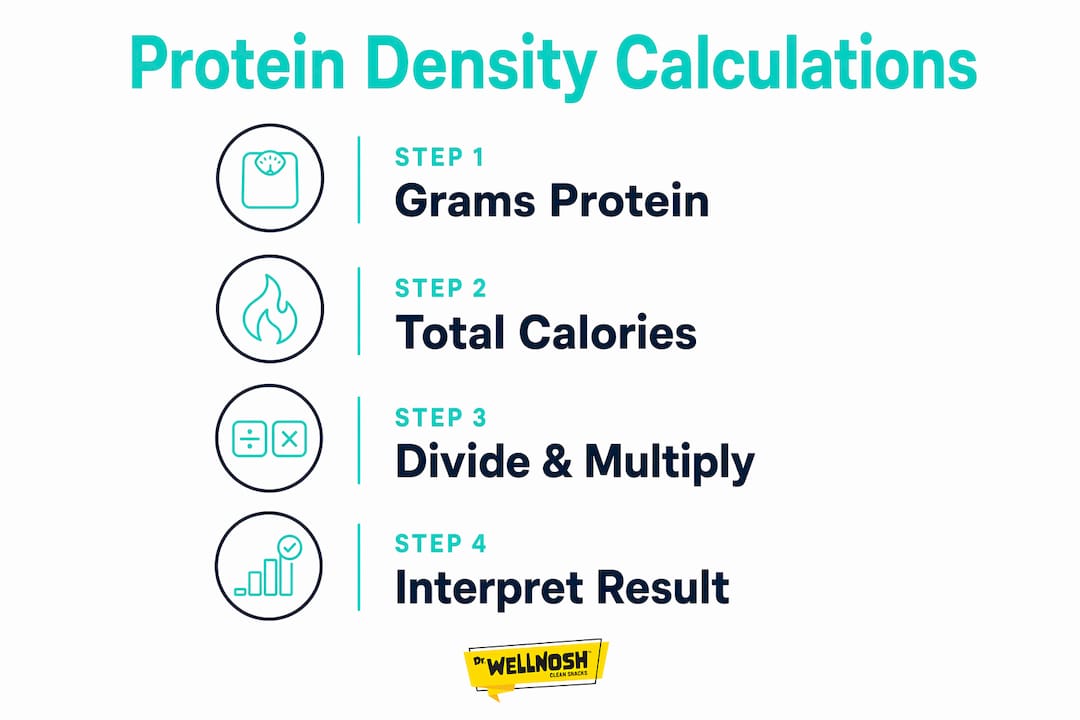
Two formulas cover everything you need. Both use numbers already printed on any Nutrition Facts label.

Formula 1: Grams of protein per 100 kcal
This is the normalized metric that lets you compare any two snacks regardless of serving size.
(g protein ÷ total calories) × 100 = g protein per 100 kcal
Formula 2: Percent of calories from protein
This tells you what share of a snack’s energy actually comes from protein.
(g protein × 4) ÷ total calories = percent of calories from protein
Snacks where protein supplies 30%+ of calories are generally considered high-protein by nutrition experts.
Worked example: a realistic snack label
Say a bag of roasted chickpeas lists: 130 calories, 7 g protein, per serving.
- Protein per 100 kcal: (7 ÷ 130) × 100 = 5.4 g/100 kcal (moderate range)
- Percent of calories from protein: (7 × 4) ÷ 130 = 28 ÷ 130 = 21.5% (below the 30% threshold)
Now run the same math on a bag of plant-based protein chips with 15 g protein and 130 calories:
- Protein per 100 kcal: (15 ÷ 130) × 100 = 11.5 g/100 kcal (very high)
- Percent of calories from protein: (15 × 4) ÷ 130 = 60 ÷ 130 = 46% (well above the 30% threshold)
Score interpretation (g protein per 100 kcal):
- >10: Very high protein density
- 8–10: High
- 5–7: Moderate
- <3: Low
One unit caution worth knowing: protein contributes 4 calories per gram, not 9 like fat. Manufacturers sometimes round calories down and protein up within FDA rounding rules, so a snack that looks borderline can tip either way. Always check the serving size first. A 28 g serving and a 56 g serving of the same product will show very different gram counts, but the protein-per-100-kcal figure stays constant, which is exactly why it’s the more reliable comparison tool.
How do common snacks actually compare by protein density?
The table below uses representative whole-food and packaged snack examples. Figures are approximate and based on standard USDA and label data.
| Snack | Typical Serving | Protein (g) | Calories (kcal) | g Protein / 100 kcal |
|---|---|---|---|---|
| Egg whites, cooked | 3 large whites | 11 | — | 21.5 |
| Canned tuna in water | 3 oz | 20 | — | 28 |
| Nonfat Greek yogurt | — | 15 | — | — |
| Low-fat cottage cheese | ½ cup | — | 90 | — |
| Plant-based protein chips | 1 bag (~1 oz) | 15 | 130 | ~11.5 |
| Beef jerky | 1 oz | 9 | — | 11.5 |
| Edamame, shelled | ½ cup | 9 | — | — |
| Roasted chickpeas | ¼ cup | 7 | 130 | ~5.4 |
| Typical protein bar | 1 bar (60 g) | 20 | 250 | 8 |
| Mixed nuts | 1 oz | 5 | — | 3 |
| Peanut butter | 2 tbsp | 7 | — | 4 |
| Standard potato chips | 1 oz | 2 | — | — |
Quick takeaways from the table:
- Lean animal proteins (tuna, egg whites, nonfat dairy) consistently score above 15 g/100 kcal, the highest protein-density tier.
- Plant-based protein chips and beef jerky both clear the 10 g/100 kcal threshold, making them genuinely high-density packaged options.
- Nuts and nut butters are calorie-dense; their protein-per-100-kcal sits in the 3–4 range. They’re nutritious, but they’re not a high-protein snack by this metric.
- Many protein bars land in the 8 g/100 kcal range, which is solid, but check the sugar content before assuming they’re a clean choice.
How much protein should a snack actually provide?
The practical answer depends on what your meals are already doing. If your breakfast and lunch each deliver 20–30 g of protein, a snack in the 10–15 g range is enough to bridge hunger, support satiety, and keep muscle protein synthesis ticking between meals. That’s the target range most registered dietitians and nutrition researchers point to for a functional snack.

For a deeper breakdown of protein per serving in snacks, including practical ways to combine protein and fiber for satiety, the Salty Everything Bagel High Protein Breakfast Bowl recipe provides a useful example to help match targets to your specific goals.
A few groups benefit from pushing toward the higher end of that range or beyond:
- Older adults (65+): Muscle protein synthesis becomes less efficient with age, so higher per-meal and per-snack protein doses help maintain lean mass.
- Active individuals and athletes: Post-workout snacks benefit from 15–25 g of protein to support muscle repair, especially when the next full meal is more than two hours away. Plant-based athletes can find practical guidance on plant protein snacks for recovery.
- People managing weight: Higher protein density increases fullness per calorie, which is useful when total calories are limited. Focusing on protein-per-calorie is one of the most practical tools for fat loss without sacrificing muscle.
Timing also matters. A snack eaten 60–90 minutes before a workout or 30–60 minutes after one has different protein requirements than a mid-afternoon snack between two protein-adequate meals. For the latter, 10 g is often plenty. For the former, closer to 15–20 g is more useful.
Why protein density alone doesn’t tell the whole story
A snack can score well on protein density and still undermine your health goals. Several factors interact with protein to determine how effective a snack actually is.
- Fiber slows digestion and extends satiety. Pairing protein with fiber produces longer-lasting fullness than protein alone. A high-protein snack with zero fiber will leave you hungry again faster.
- Fat type and amount affect both satiety and cardiovascular health. Unsaturated fats (avocado oil, olive oil) add satiety without the inflammatory downside of seed oils or the saturated fat load of many animal-based snacks.
- Added sugars dilute nutrient quality and spike blood sugar, which can accelerate hunger rather than suppress it. A snack with 20 g protein but 25 g added sugar is a net negative for most health goals.
- Processing and fillers matter more than most labels reveal. Protein isolates and hydrolyzed proteins can inflate gram counts without delivering the full amino acid profile or the satiety of whole-food protein sources.
- Protein quality varies by source. Complete proteins (those containing all nine essential amino acids) include eggs, dairy, meat, fish, and some plant combinations. Fava beans, for example, are a strong plant-based source with a favorable amino acid profile compared to many other legumes.
For heart-conscious snackers, plant-based protein sources like legumes, tofu, and bean-based chips reduce saturated fat and cholesterol intake while still delivering meaningful protein density when paired with fiber. That’s a real advantage over high-protein animal snacks that come with significant saturated fat.
A practical checklist for choosing protein-dense snacks
Use this when you’re reading a label in a store or scrolling a product page online.
What to look for:
- Calculate protein per 100 kcal (aim for 8+, ideally 10+)
- Check that protein supplies at least 30% of total calories
- Look for at least 2–3 g of fiber per serving
- Added sugar under 10 g per serving
- Whole-food protein sources near the top of the ingredient list (beans, legumes, dairy, eggs, lean meat)
- Fat from unsaturated sources (avocado oil, olive oil, nuts)
- Serving size that matches how you actually eat the product
Red flags:
- “High protein” on the front with fewer than 8 g/100 kcal when you do the math
- Protein isolate or hydrolyzed protein as the first ingredient, paired with high sugar
- Sugar-to-protein ratio above 1:1 (more grams of sugar than protein)
- Seed oils (sunflower, canola, soybean) as the primary fat source
- Ingredient list longer than 10–12 items with unrecognizable additives
Pro Tip: Pair a small cup of nonfat Greek yogurt with a handful of walnuts for a snack that clears 15 g protein, adds fiber, and delivers healthy fats. Or grab a bag of protein chips alongside a small serving of hummus for a plant-based combo that hits both protein and fiber targets without any prep.
For a deeper look at ingredients to avoid in diet snacks, the Wellnosh blog covers the most common label traps in detail.
Common misconceptions about “high-protein” snack claims
The phrase “high protein” on a package is a marketing claim, not a regulated nutritional standard. Here’s what it often hides.
- “High protein” doesn’t mean protein-dense by calories. A snack can list 10 g of protein per serving while delivering 400 calories, putting its protein density at just 2.5 g/100 kcal. That’s lower than most standard snacks. Front-of-package claims frequently mask high sugar or seed-oil content.
- Grams per serving vs. density are different numbers. A larger serving size inflates the gram count without improving the protein-to-calorie ratio. Always normalize to 100 kcal before comparing.
- Added sugar or excess fat can negate the protein benefit. Many mass-market protein bars and flavored protein chips carry 15–20 g of added sugar alongside their protein. The sugar spike undermines the satiety benefit the protein was supposed to provide.
- The “3-3-3 rule” has limits. Some guides suggest looking for at least 3 g protein, 3 g fiber, and 3 g fat per snack. That’s a reasonable floor for a light snack, but it sets the bar low. A snack with 3 g protein and 200 calories scores just 1.5 g/100 kcal. Use the percent-of-calories method or the per-100-kcal score for a more accurate read.
- Checking %DV for protein on the label is less useful than running the math yourself. The FDA’s %DV for protein is based on 50 g per day, which is the minimum RDA, not an optimal target for active or health-focused adults.
The fastest check: multiply protein grams by 4, divide by total calories. If that number is below 0.30, the snack isn’t genuinely protein-rich by calorie share, regardless of what the front says.
What the research actually says about protein density
The evidence base for protein density as a snack metric is solid and growing.
A PMC-published study using the Nutrient-Rich Foods (NRF) Index found that yogurt, milk, and fruit scored highest for overall nutrient density among common snack categories, while carbonated soft drinks, pies, and ice cream scored lowest. The study evaluated snacks per 100 kcal, which is exactly the normalization method this guide recommends. Protein was one of ten nutrients to encourage in the NRF Index scoring, alongside fiber, calcium, and potassium.
Harvard Health guidance reinforces that protein paired with fiber produces better satiety outcomes than protein alone. Registered dietitians consistently recommend targeting whole-food protein sources and keeping added sugar below 10 g per serving when evaluating packaged options.
For daily targets, aiming for an average of roughly 8–10 g protein per 100 kcal across your snacks is a useful starting point for fat loss or muscle retention. Individual snacks can vary above or below that range, but the average matters more than any single choice.
Key Takeaways
Protein density, measured as grams per 100 kcal or percent of calories from protein, is the most reliable way to evaluate snack foods because it exposes what front-of-package claims routinely obscure.
| Point | Details |
|---|---|
| Protein density formula | Divide grams of protein by total calories, then multiply by 100 to get g protein per 100 kcal. |
| Practical snack target | Aim for 10–15 g protein per snack and a density score of 8+ g per 100 kcal. |
| 30% calorie threshold | Snacks where protein supplies 30%+ of total calories qualify as genuinely high-protein. |
| Top label red flags | High sugar-to-protein ratio, seed oils as primary fat, and protein isolates paired with added sugar. |
| Wellnosh protein chips | Deliver 15 g fava bean protein per bag at roughly 11.5 g/100 kcal, with no added sugar and avocado oil as the fat source. |
Why protein density is the metric the snack industry doesn’t want you to use
Most snack marketing is built around gram counts, not density. That’s not an accident. A 60 g protein bar can legitimately claim “20 g protein” while delivering 250 calories and 18 g of added sugar. Run the density math and it scores 8 g/100 kcal, which is decent, but the sugar load undercuts the satiety benefit almost entirely.
What I find more interesting is how the plant-based snack category has quietly closed the gap with animal-based options on this metric. Fava bean protein, in particular, delivers a complete amino acid profile that most legumes can’t match, and when it’s the primary ingredient in a chip cooked in avocado oil with no added sugar, the resulting density score competes directly with beef jerky and edges past most protein bars. That’s a meaningful shift for anyone who wants clean snacking without relying on dairy or meat.
The checklist in this guide isn’t complicated, but most people never use it because the front of the package is designed to make the math feel unnecessary. It isn’t. Two minutes with a calculator changes how you shop for snacks permanently.
Wellnosh protein chips meet the protein-density checklist
If you’ve run through the checklist in this guide and want a packaged snack that already clears every box, Wellnosh plant-based protein chips are worth a look. Each bag delivers 15 g of fava bean protein at roughly 11.5 g per 100 kcal, well above the 8 g threshold for a high-density snack. There’s no added sugar, no seed oils, and the fat source is avocado oil. The ingredient list is short and pronounceable. Non-GMO, gluten-free, and low-carb.
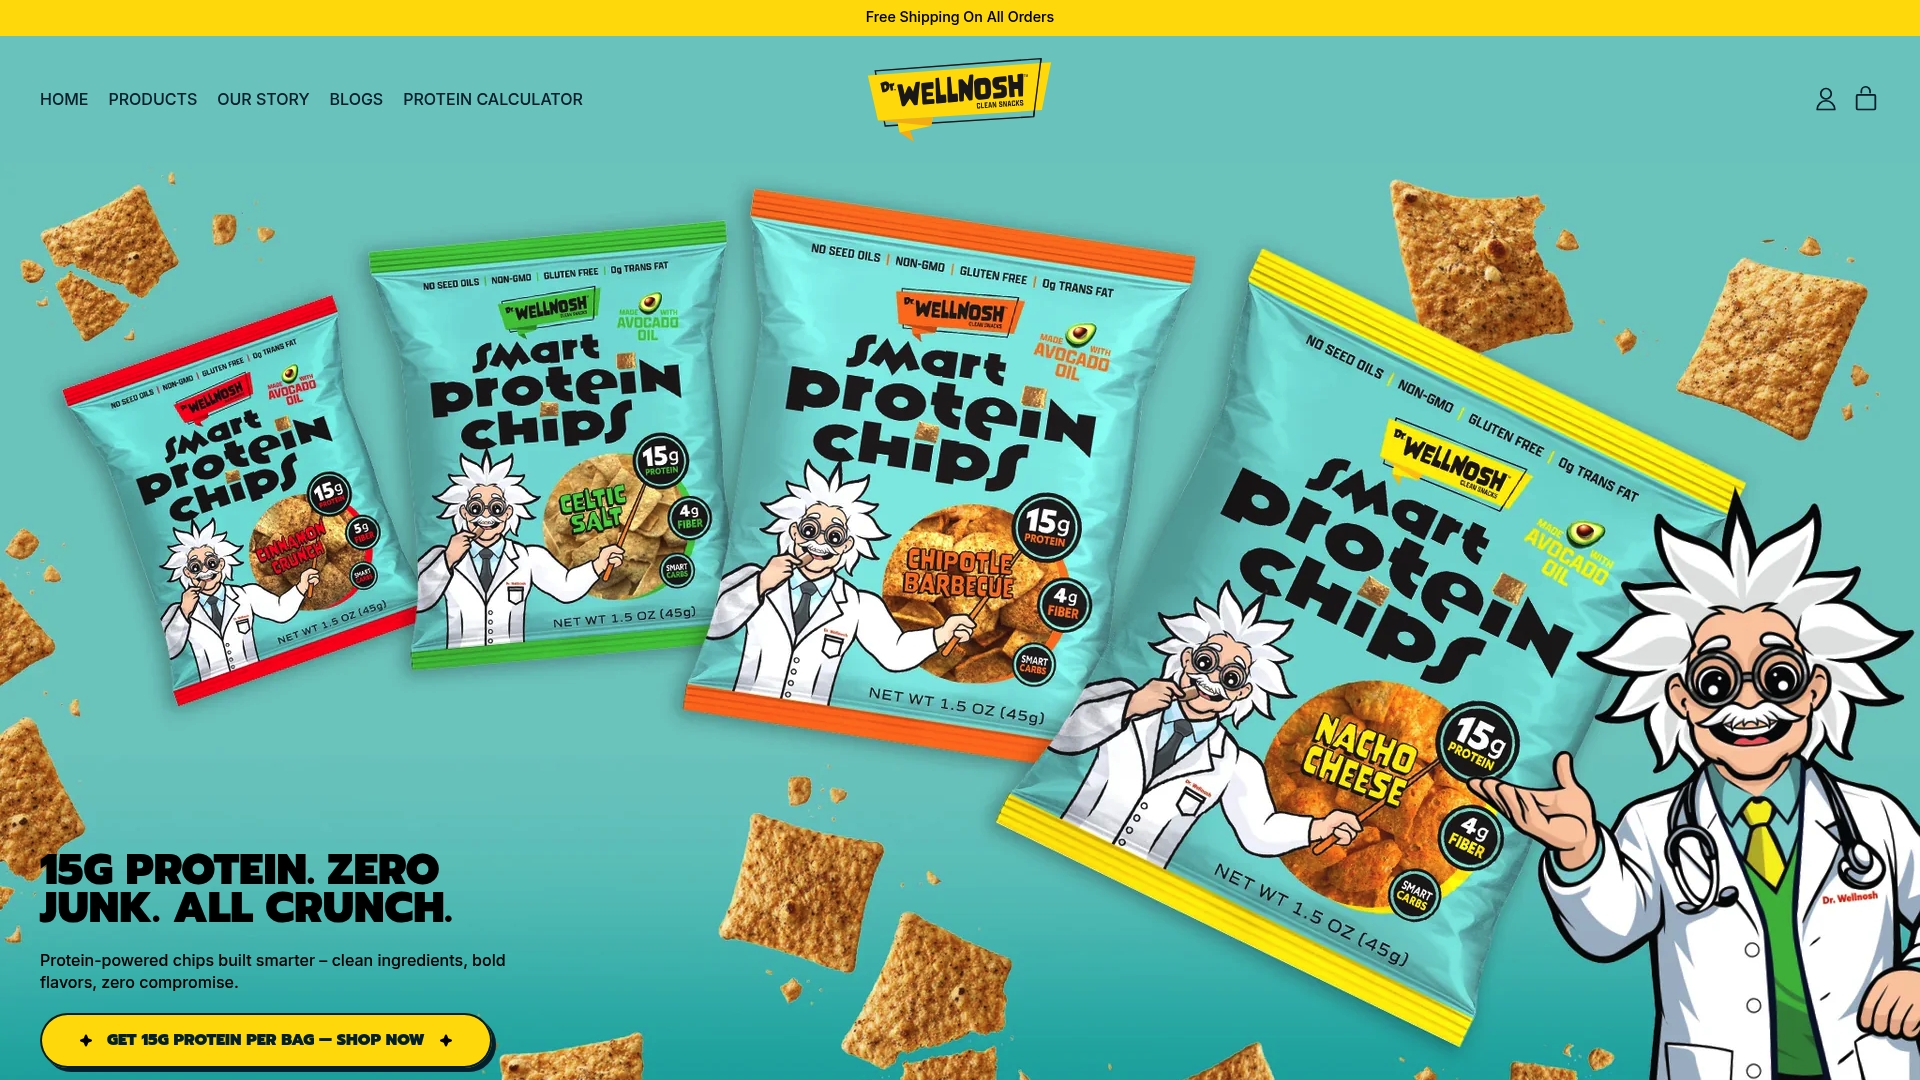
The Chipotle Barbecue flavor is currently available for one-time purchase or via Subscribe & Save. The Chipotle Barbecue out-of-stock and Cinnamon flavors are temporarily unavailable, but you can check the product pages for restock updates. The Variety Pack is a good starting point if you want to try multiple flavors before committing to a subscription.
Useful sources for further reading
- The Nutrient Density of Snacks: NRF Index Study — PMC/NIH
- High-protein snacks to build muscle and keep hunger at bay — Harvard Health
- Are high-protein snacks worth the hype? — NPR/KPBS
- Protein per 100 kcal explained — Reshape App
- 10 Packaged Protein Snacks That Taste Good and Keep You Full — MyFitnessPal Blog
- High-protein snacks for heart health — Prevention
- Nutrient-dense snacks explained for busy professionals — Wellnosh


